Metrics system
The metrics system collects measurements from every part of the network, stores the latest values, and makes them available to policies (for load balancing, auto-scaling and placement) and to people (for monitoring).
At a glance
Three kinds of metrics: hardware (nodes and clusters), blocks, and vDAGs.
Two levels of storage: a local database in each cluster, and global databases on the management cluster.
Note: these databases hold the current values, not history. For history, connect the optional Prometheus deployment, and Grafana for dashboards.
What is measured
| Kind | Examples | Collected by |
|---|---|---|
| Hardware metrics | CPU, memory, disk, network and GPU usage of each node | A DaemonSet on every node |
| Block metrics | Latency, throughput, queue length; plus any custom metrics you add | Each block's executor and instances |
| vDAG metrics | End-to-end latency, throughput | Each vDAG controller |
Architecture
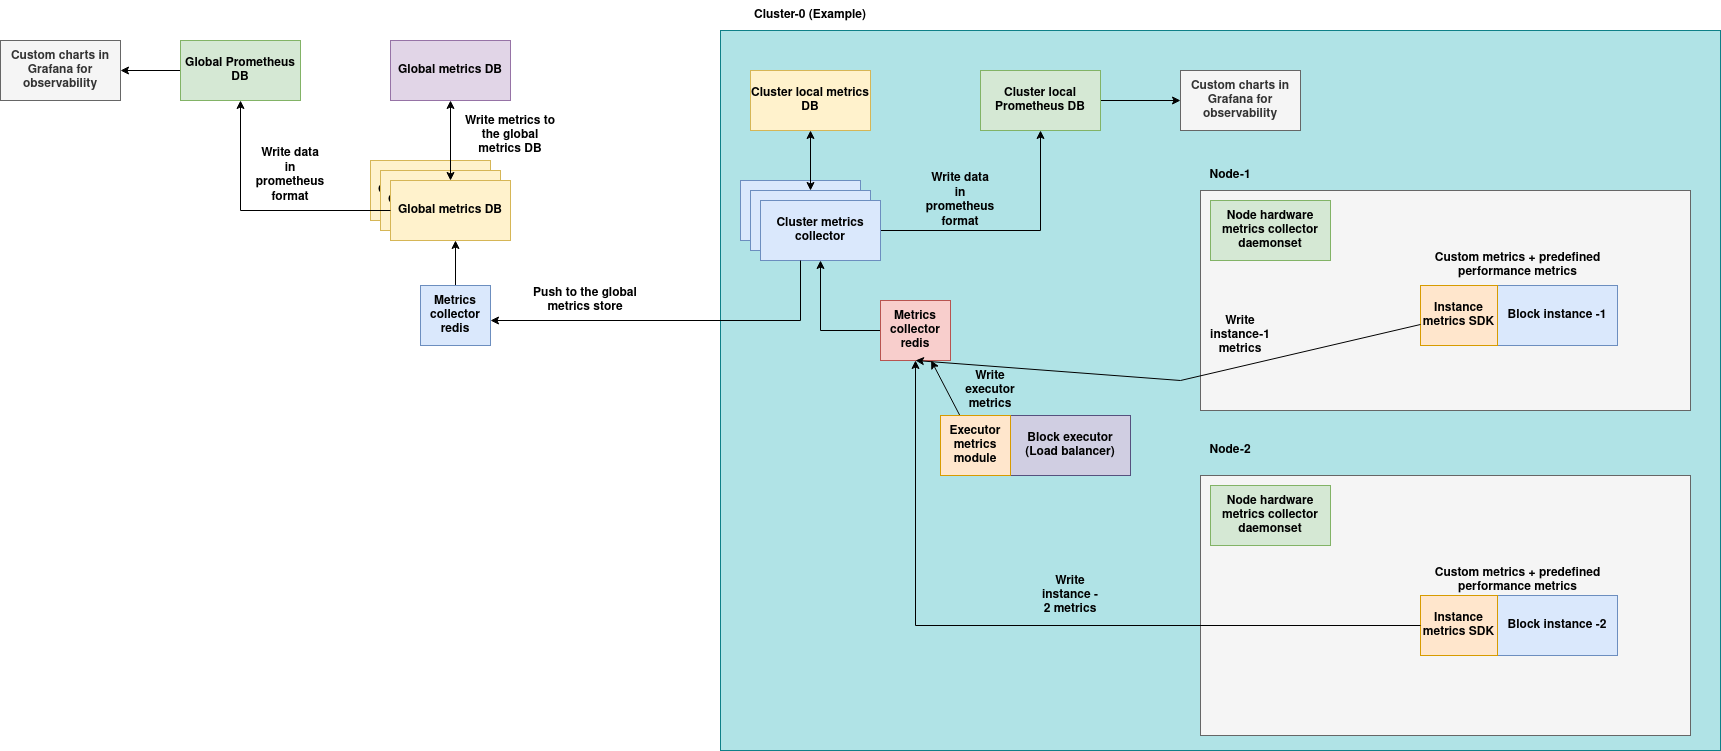
(Download the architecture diagram)
flowchart LR
    subgraph Cluster
        D["Node metrics DaemonSet<br/><small>every node</small>"] --> L[("Local metrics DB")]
        B["Block executor + instances<br/><small>metrics SDK</small>"] --> L
    end
    L -->|"periodic"| G[("Global cluster and<br/>block metrics DBs")]
    V["vDAG controllers"] --> GV[("Global vDAG metrics DB")]
    L -. "read by" .-> P1["Block policies<br/><small>load balancer, auto-scaler</small>"]
    G -. "read by" .-> P2["Placement policies,<br/>dashboards, users"]
In each cluster
| Component | What it does |
|---|---|
| Node metrics DaemonSet | Runs on every node in host mode and collects CPU, memory, disk, network and GPU usage. |
| Metrics SDK and executor metrics | Built into the Instance SDK and the block executor, providing the standard metrics plus your custom metrics. Pushes them to the local database periodically. |
| Local metrics database | Holds the current metrics of every block and node in the cluster. Optionally backed by Prometheus, which can keep history for as long as storage allows, and Grafana for charts. |
On the management cluster
| Component | What it does |
|---|---|
| Global metrics databases | Hold the current metrics reported by every cluster (clusters, blocks) and every vDAG controller. Optionally backed by Prometheus and Grafana. |
Hardware metrics
Node metrics DaemonSets
Every node that joins a cluster runs a metrics pod as a DaemonSet, in privileged mode so that it can read the host's hardware. At fixed intervals it collects:
- CPU, memory, storage and network metrics (using
psutil) - GPU metrics, if GPUs are present (using NVIDIA NVML)
and pushes them to the cluster's local metrics database.
Full list of hardware metrics (click to expand)
CPU
| Name | Description |
|---|---|
load1m |
System load average over the last minute |
load5m |
System load average over the last 5 minutes |
load15m |
System load average over the last 15 minutes |
runningThreads |
Currently running threads |
runningProcesses |
Currently running processes |
totalThreads |
Total threads |
totalProcesses |
Total processes |
Memory
| Name | Description |
|---|---|
freeMem |
Free memory |
usedMem |
Used memory |
averageUtil |
Average memory utilization (%) |
usedSwap |
Swap in use |
freeSwap |
Free swap |
pageFaultsPerSec |
Page faults per second |
Disk
| Name | Description |
|---|---|
memory.freeMem |
Free disk space |
memory.usedMem |
Used disk space |
memory.maxDisk |
Maximum disk space available |
memory.minDisk |
Minimum disk space available |
iops.blocksPerSec |
Blocks read or written per second |
iops.readBytes |
Bytes read |
iops.writeBytes |
Bytes written |
iops.total |
Total I/O operations per second |
iops.active |
Active I/O operations |
iops.response |
Average I/O response time |
Storage
| Name | Description |
|---|---|
freeMem |
Free storage |
usedMem |
Used storage |
Network
| Name | Description |
|---|---|
txBytesTotal |
Total bytes sent |
rxBytesTotal |
Total bytes received |
Per GPU
| Name | Description |
|---|---|
gpu_id |
GPU ID |
usedMem |
Used GPU memory (MB) |
freeMem |
Free GPU memory (MB) |
totalMem |
Total GPU memory (MB) |
memUtilization |
GPU memory utilization (%) |
cudaUtilization |
CUDA core utilization (%) |
powerUtilization |
Power utilization (currently always 0) |
temperature |
GPU temperature |
All GPUs on a node (aggregated)
| Name | Description |
|---|---|
totalUsedMem |
Used memory across all GPUs (MB) |
totalFreeMem |
Free memory across all GPUs (MB) |
totalMem |
Total memory across all GPUs (MB) |
avgMemUtilization |
Average memory utilization (%) |
avgCudaUtilization |
Average CUDA utilization (%) |
avgPowerUtilization |
Average power utilization |
avgTemperature |
Average temperature |
count |
Number of GPUs |
Local metrics database
Each cluster has its own local metrics database. It stores the latest hardware metrics from every node, and is what services such as a block's load balancer and auto-scaler read when making decisions. It is reachable through the cluster gateway at /metrics, or on NodePort 32301.
| Endpoint | Method | Returns |
|---|---|---|
/node/<node_id> |
GET |
Metrics for one node. |
/node/query |
POST |
Nodes matching a MongoDB-style filter ($eq, $gt, $in, ...). |
/cluster |
GET |
All nodes' metrics plus cluster-wide aggregates. Used by many internal components. |
curl -X GET http://<server-url>/node/<node-id>

# Nodes whose 15-minute load is below 2
curl -X POST http://<server-url>/node/query \
  -H "Content-Type: application/json" \
  -d '{ "metrics.resource.node.vcpu.load_15m": { "$lt": 2 } }'

curl -X GET http://<server-url>/cluster
Global cluster metrics database
Every cluster's local database periodically reports its latest aggregated metrics to the global cluster metrics database (global-cluster-metrics, NodePort 30202), for network-wide monitoring and placement decisions.
| Endpoint | Method | Returns |
|---|---|---|
/cluster/<cluster_id> |
GET |
Metrics for one cluster. |
/cluster/query |
POST |
Clusters matching a MongoDB-style filter. |
curl -X GET http://<server-url>/cluster/<cluster-id>

# Clusters with more than ~50 GB of free memory
curl -X POST http://<server-url>/cluster/query \
  -H "Content-Type: application/json" \
  -d '{
    "cluster.memory.freeMem": {"$gt": 50000}
  }'
Block metrics
Collected from each block's executor and instances.
Standard metrics
Always available for every block, with no code needed.
Executor
| Name | Description |
|---|---|
tasks_processed |
Tasks processed by the executor |
latency |
Average end-to-end latency of tasks (seconds) |
Instances
| Name | Description |
|---|---|
on_preprocess_latency |
Time spent in on_preprocess |
on_data_latency |
Time spent in on_data |
end_to_end_latency |
Total processing time per task |
on_preprocess_count |
Number of on_preprocess calls |
on_data_count |
Number of on_data calls |
end_to_end_count |
Number of tasks processed |
on_preprocess_fps |
on_preprocess calls per second |
on_data_fps |
on_data calls per second |
end_to_end_fps |
Tasks processed per second |
queue_length |
Length of the block's input Redis queue |
Custom metrics
Add your own metrics with AIOSMetrics, available in your block as context.metrics. It registers and updates Prometheus counters, gauges and histograms, exposes them over HTTP, and publishes them through Redis. The Instance SDK guide shows how to use it inside a block.
AIOSMetrics(block_id: Optional[str] = None)
block_id defaults to the BLOCK_ID environment variable, or "test-block".
| Environment variable | Purpose | Default |
|---|---|---|
BLOCK_ID |
Block ID used to tag metrics | — |
INSTANCE_ID |
Instance ID | "instance-001" |
METRICS_REDIS_HOST |
Redis host for publishing metrics | — |
| Method | Description |
|---|---|
register_counter(name, documentation, labelnames=None) |
Create a counter. |
register_gauge(name, documentation, labelnames=None) |
Create a gauge. |
register_histogram(name, documentation, labelnames=None, buckets=None) |
Create a histogram. Default buckets: [0.1, 0.2, 0.5, 1, 2, 5, 10]. |
increment_counter(name, labelnames=None) |
Add one to a counter. |
set_gauge(name, value, labelnames=None) |
Set a gauge. |
observe_histogram(name, value, labelnames=None) |
Record a value in a histogram. |
Note
The labelnames argument of the update methods is currently ignored.
import os
from aios_metrics import AIOSMetrics

# Set environment variables if needed
os.environ["BLOCK_ID"] = "block-123"
os.environ["INSTANCE_ID"] = "instance-xyz"

metrics = AIOSMetrics()

# Register
metrics.register_counter("tasks_processed", "Number of tasks processed")
metrics.register_gauge("latency", "End-to-end latency of task processing")
metrics.register_histogram("inference_duration", "Histogram of inference durations")

# Update
metrics.increment_counter("tasks_processed")
metrics.set_gauge("latency", 0.432)
metrics.observe_histogram("inference_duration", 1.2)
Local block metrics database
Holds the current metrics (standard and custom) of every block and instance in the cluster, for local decision-making.
| Endpoint | Method | Returns |
|---|---|---|
/block/<block_id> |
GET |
All metrics for one block. |
/block/query |
POST |
Blocks matching a MongoDB-style filter. |
curl -X GET http://<server-url>/block/<block-id>

curl -X POST http://<server-url>/block/query \
  -H "Content-Type: application/json" \
  -d '{
    "metrics.latency.latency": {"$lt": 3}
  }'
Global block metrics database
Each cluster's local database periodically reports to the global block metrics database (global-block-metrics, NodePort 30201), which covers every block in the network.
| Endpoint | Method | Returns |
|---|---|---|
/block/<block_id> |
GET |
Metrics for one block. |
/block/query |
POST |
Blocks matching a MongoDB-style filter. |
curl -X GET http://<server-url>/block/<block-id>

curl -X POST http://<server-url>/block/query \
  -H "Content-Type: application/json" \
  -d '{
    "metrics.latency.latency": {"$lt": 3}
  }'
vDAG metrics
Each vDAG controller reports directly to the global vDAG metrics database (global-vdag-metrics, NodePort 30203), at fixed intervals.
| Name | Description |
|---|---|
inference_requests_total |
Total inference requests processed |
inference_fps |
Inference throughput (frames per second) |
inference_latency_seconds |
Latency per request (seconds) |
| Endpoint | Method | Returns |
|---|---|---|
/vdag/<vdag_id> |
GET |
Metrics for one vDAG. |
/vdag/query |
POST |
vDAGs matching a MongoDB-style filter. |